
Ask Brian McFee is a new regular column in which letters sent by members across the SpokenWeb network concerning the digital analysis of sound are answered by our resident computational audio expert, Brian McFee (NYU). Do you have a question about how we can use computers to analyze sound? Send them to the SWB editorial team at spokenweblog@gmail.com and watch for Brian’s response in a future SWB post. Enjoy the first post in this new series!
Dear Brian,
I was recently listening to an episode of the SpokenWeb podcast where grad student and research assistant Ali Barillaro speaks about the place of applause in poetry performances. Anyone who has ever been a performer, or been to a performance (poetic or otherwise), knows that not all applause is created equal: from polite and perfunctory to enthusiastic and encore-rousing, applause carries many connotations – not all of which, Barillaro explains, can be captured in waveforms and spectrograms.
So, this has me wondering about a couple of things. First, is it possible to use AI to find and separate out all of the applause from the other sounds (speech, etc.) in a recorded poetry reading? If that can be done, then I have a second question. Could a computer somehow distinguish between one kind of applause and another? Can AI tell us which performances were the biggest hits (uproarious ovation) – or alternatively, the biggest busts (tentative smatterings of limp-handed claps)? What about the aspects of applause that seem less quantifiable than things like volume and duration – like the audience’s mood or level of engagement? Certainly, there’s a difference between an awkward pause or a missed cue versus a thoughtful silence – but can AI tell the difference? Can AI discern between the irony of a slow-clap compared to an impactful pause?
Is it a matter of just having to have “been there” to assess the audience’s mood, or are there other ways we can discern the audience’s overall vibe from a recording alone?
Sincerely yours,
Standing Ovation
Dear Standing Ovation,
Your questions deserve some applause, and there’s quite a bit to unpack here!
Your first question, separating applause from speech, would fall broadly under the category of “speech enhancement” technology. Speech enhancement is often used to suppress a variety of annoying background sounds that our ears can be quite good at tuning out automatically, but which machines have trouble with. Think of air conditioners, keyboard clacking in a busy office, or cars driving by outside. Speech enhancement tools essentially work by exploiting the different statistical nature of “speech” sound from “non-speech” sound, and for certain kinds of background noise, they can be quite effective. I wouldn’t expect them to do well at suppressing other natural or vocal sounds (dogs barking, birds chirping), but applause is certainly more similar to machine noises than animal noises, and I would expect applause-speech separation to be quite effective. As long as there aren’t too many hecklers in the audience.
Your second question. To get a sense of how to begin thinking about classifying different kinds of applause, it’s first helpful to dig up some examples and get both a quantitative and qualitative feel for them. The Freesound archive is a great resource for this kind of thing, and I was able to find three examples consisting of what I perceive as light, moderate, and intense applause. After listening to each of these, I then looked at some visualizations of their waveforms and spectrograms. (For the unfamiliar, a spectrogram is a graphical representation of how the amount of energy in a signal at different frequencies changes over time.)
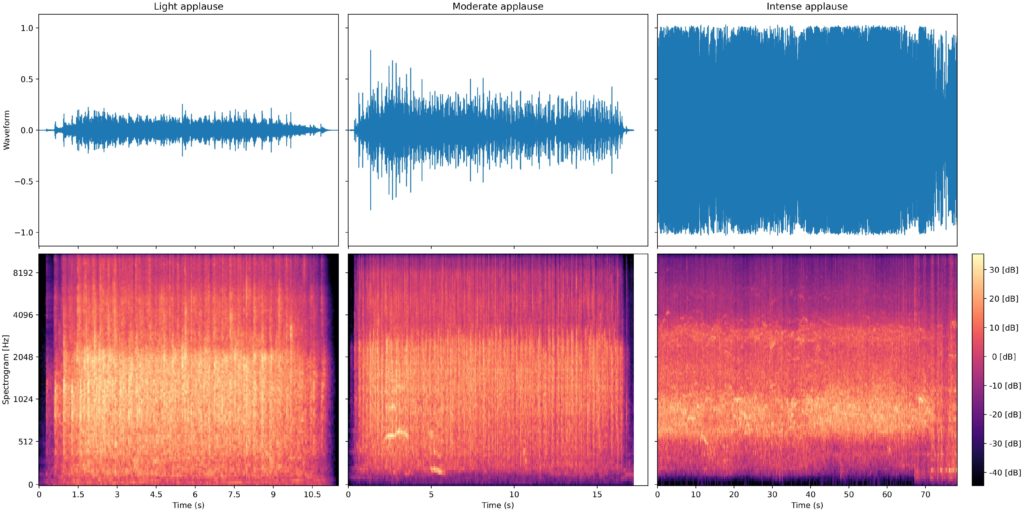
There are several things we can observe here. Perhaps the most visually salient distinction between the three examples is the overall intensity—loosely speaking, the “loudness”—which is seen by the height of the waveform plots in blue. The “light intensity” example has a relatively small amplitude, while the “intense” example looks like a solid wall of blue. This can be deceiving though, as the “quieter” example might simply have a lower gain applied to its microphone, or have been recorded at a greater distance.
There are some other cues that we can look for though: the next one that pops out to my eye is the duration: the light example is around ten seconds long, while the intense example lasts for over a minute. This of course matches our intuitive expectation: the applause that you see at the end of an arena rock concert before the encore will usually last for much longer than a golf clap. This seems like it should be an obvious candidate for a feature to use for classification, but there’s a catch. To use duration, we’d need to detect when applause begins and ends with a reasonable degree of accuracy. This is probably not too difficult of a task, and could probably be implemented rather effectively by an intensity threshold.
Aside from duration, there are other distinguishing features we could look for. Below, I’ve fixed the three examples to focus on just the first five seconds:
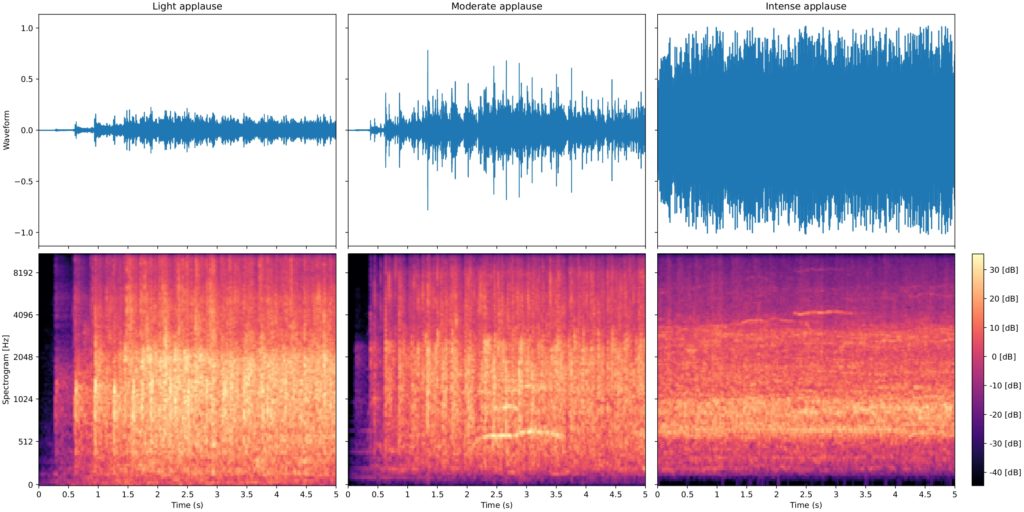
At a smaller time scale, we can begin to see some more distinct features. For example, the horizontal streaks in the moderate and intense examples correspond to vocalizations in the crowd (whoops and hollers) that would be unlikely in a “light applause” situation. These kinds of patterns are the kind of thing that can be easily detected by a machine, using essentially the same algorithms that so-called “smart devices” use to detect when they’re being addressed by a wake word like “Ok Google” or “Hey Siri”.
Finally, the vertical banding in the “light applause” can likely be attributed to individual hand-claps. These become more tightly spaced in the “moderate” example due to the increased density of clapping, and completely smear together in the “intense” case to form an undifferentiated background noise. These patterns could also be represented, for example, by looking at how energy in different frequency bands varies over time. This quantity, combined with an overall summary of the intensity and general “shape” of the energy distribution over frequencies would probably lead to a pretty good representation.
Bravo to you for these excellent questions. Keep them coming!
Brian
Brian McFee
Brian McFee is Assistant Professor of Music Technology and Data Science at NYU Steinhardt and the NYU Center for Data Science. He holds a B.S. degree in Computer Science (2003) from the University of California at Santa Cruz, and M.S. (2008) and Ph.D. (2012) degrees in Computer Science and Engineering from the University of California at San Diego.
His research lies at the intersection of machine learning, signal processing, and information retrieval, with the overarching goal of developing algorithms to expose latent structure in recorded audio. He is an active developer of open source scientific software, and is the primary maintainer of the librosa package for audio content analysis.
Dr. McFee’s primary contribution to the project will be to design and develop materials for a training workshop on computational analysis of spoken word audio recordings. In service of this, he plans to recruit a student (masters level) to assist with developing materials and software, which will be of general benefit to the project in the long term.